Dashboard Overview
Once you have launched your initial outreach, deal performance can be tracked from the Dashboard tab. This dashboard is visible to all deal team members.
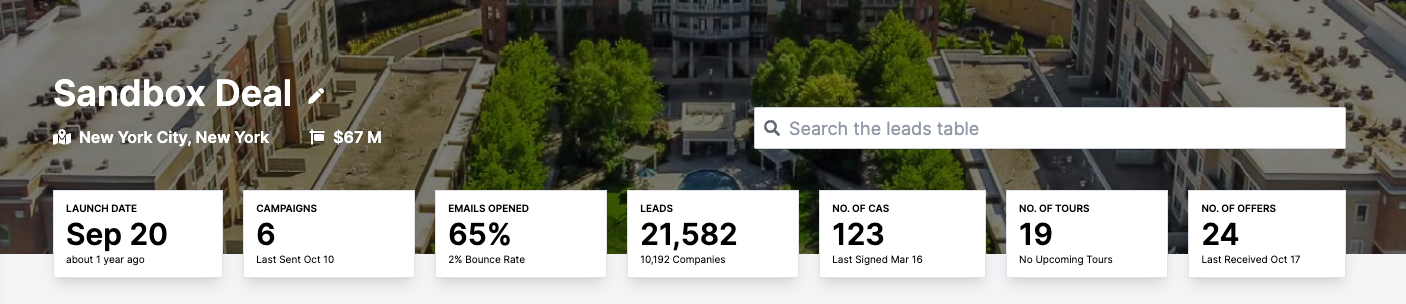
Along the top, you will notice a variety of metrics shown, such as the deal's launch date, number of campaigns, and more. Clicking on any of these metric cards will take you to a page where you can view relevant information related to these metrics.
Next to your deal's name, you may also click the pencil icon as a shortcut to the deal editor.
You may also choose to search the leads table directly from the top of the dashboard. Simply search as you would normally from the leads table and hit enter, or click the arrow on the right side.
Deal Stages and Upcoming Milestones

You can track your deal's lifecycle through the deal stages shown under the metrics cards. The stage you are currently in will be bolded. You may click on Project Launched, Under Contract, or Closed to open a form which will let you move your deal to that stage or edit relevant information. For example, you may open the "Project Launched" form at any time to add key marketing dates.
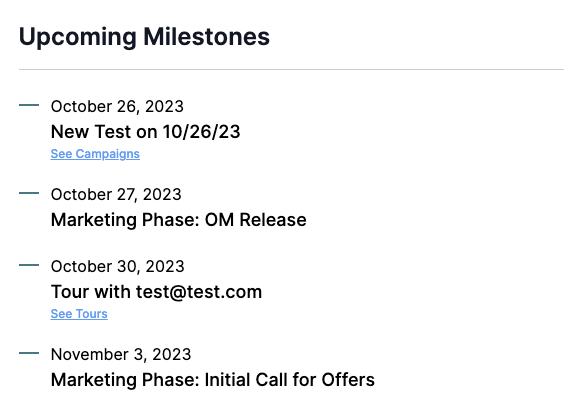
Click on "View All Upcoming Milestones" to see future tours, campaigns, and key marketing dates in chronological order. You may use this to help keep track of the upcoming steps for a deal.
You may also mark your deal as "Inactive/Closed Lost" by clicking the "Closed" stage and then clicking "Mark as Inactive/Closed Lost" in the lower right.
Project Overview
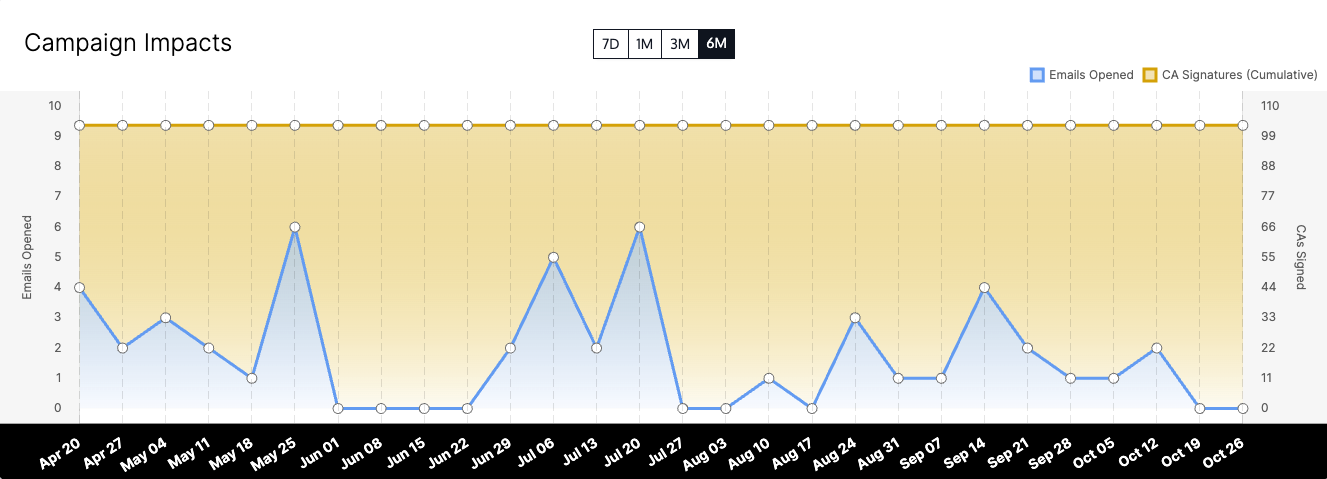
You may view the number of email opens bucketed by a certain time range and cumulative CA signatures on the campaign impacts graph. If you have campaigns or key marketing dates, these will also be overlaid on top of the graph so you can easily view how they affect your deal's performance. You may toggle the time ranges at the top to show only the last seven days, the past month, past three months, or past 6 months depending on if you want to view recent or overall trends for your deal.
You may also hover over any point on the graph to see the number of emails opened or cumulative CAs for that time period.
For EDSF deals, instead of cumulative CA signatures, you will see cumulative documents downloaded.
Breakdown of Campaign Performance
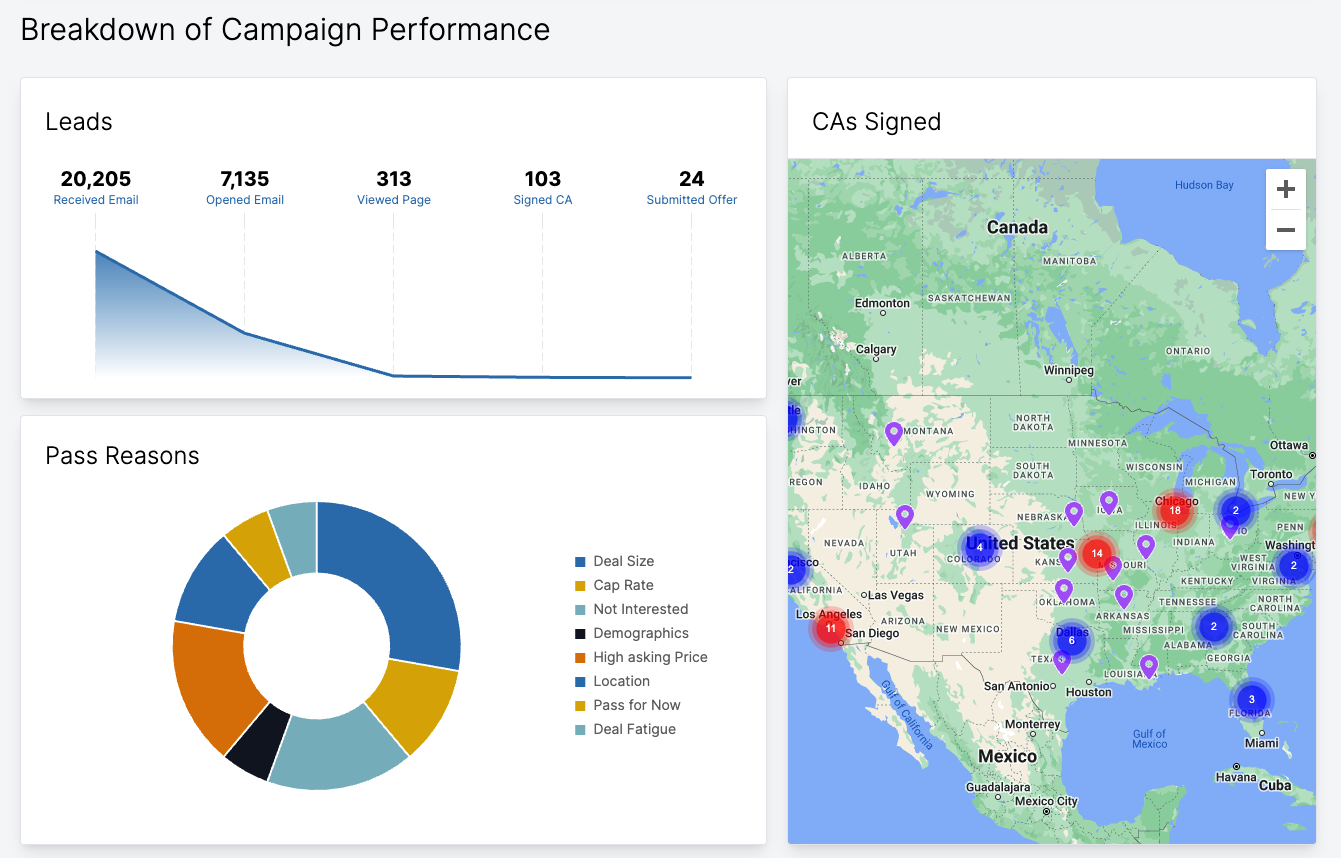
For investment sale deals, the "Leads" chart will show you the aggregated number of leads who have received a campaign email, opened an email, viewed your deal page, signed a CA, or submitted an offer. Click on any of these metrics to be taken to the corresponding set of individuals in the leads table.
For EDSF deals, a corresponding set of metrics are shown.
The Pass Reasons section will show you why potential investors are passing on the deal. When an investor passes on the deal, they will be prompted to include a pass reason. If they pass via phone call or email, you can also manually input this information via the leads table. Pass reasons are stored and can be used to inform on investor preferences for future deals.
You can also view the locations of all CA signers through an interactive map. Navigate by clicking and holding then moving your mouse or sliding your finger on your trackpad. Click on a pin to view the CA signers, or click on a cluster to zoom in.
Reports

Download an Automated Marketing Report, Signed CAs report, Data Room Downloads report, or Call Notes Summary from the navigation bar. On smaller screens, you may have to click the down arrow by "Quick Actions" to see these options. (For more information on the Automated Marketing Report, please refer to Automated Marketing Report).